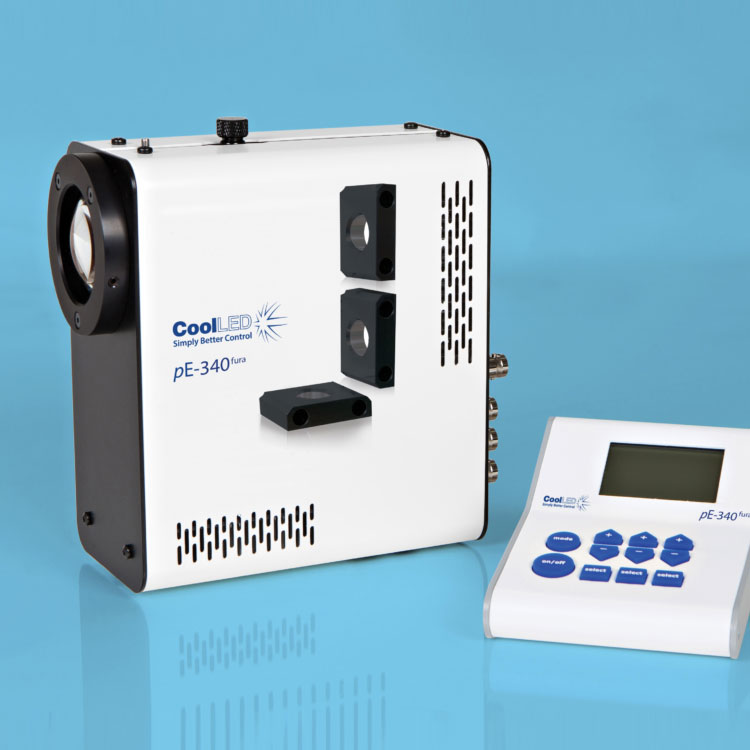
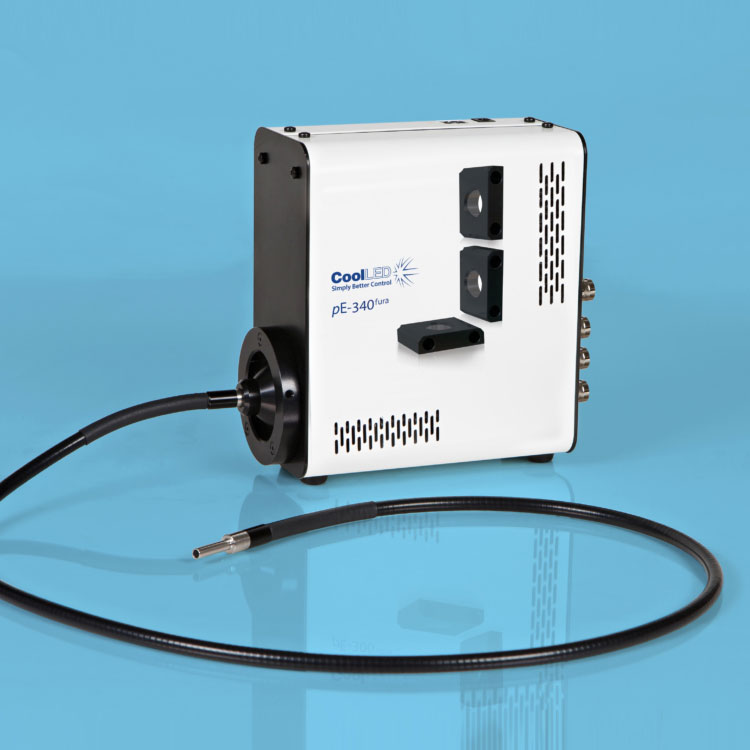
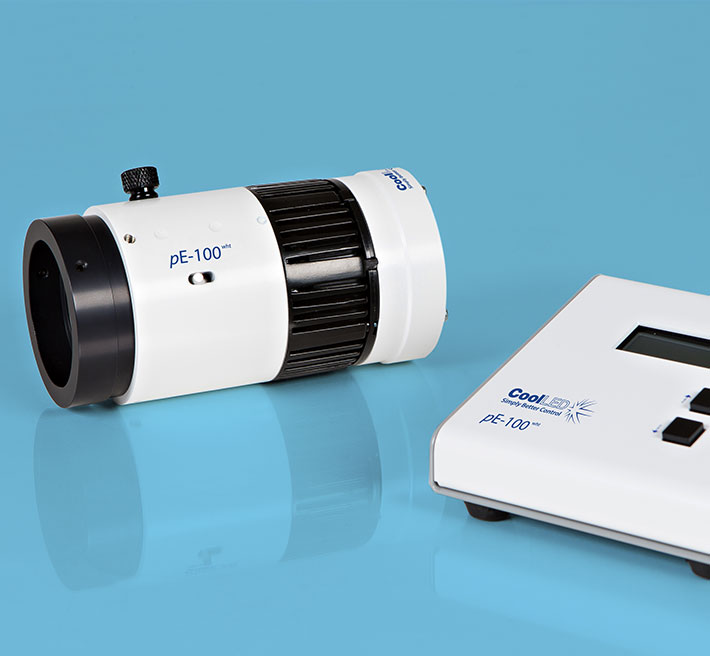
Utilising the successful pE-300 Series platform, the pE-340fura is a bespoke LED Illuminator for Fura-2 ratiometric calcium imaging, which also supports everyday fluorescence microscopy in a compact and affordable package.
The 340nm and 380nm LED illumination system provides the optimum excitation wavelengths for Fura-2-based calcium imaging allowing high-precision, stable, high-throughput imaging with video-rate time resolution.
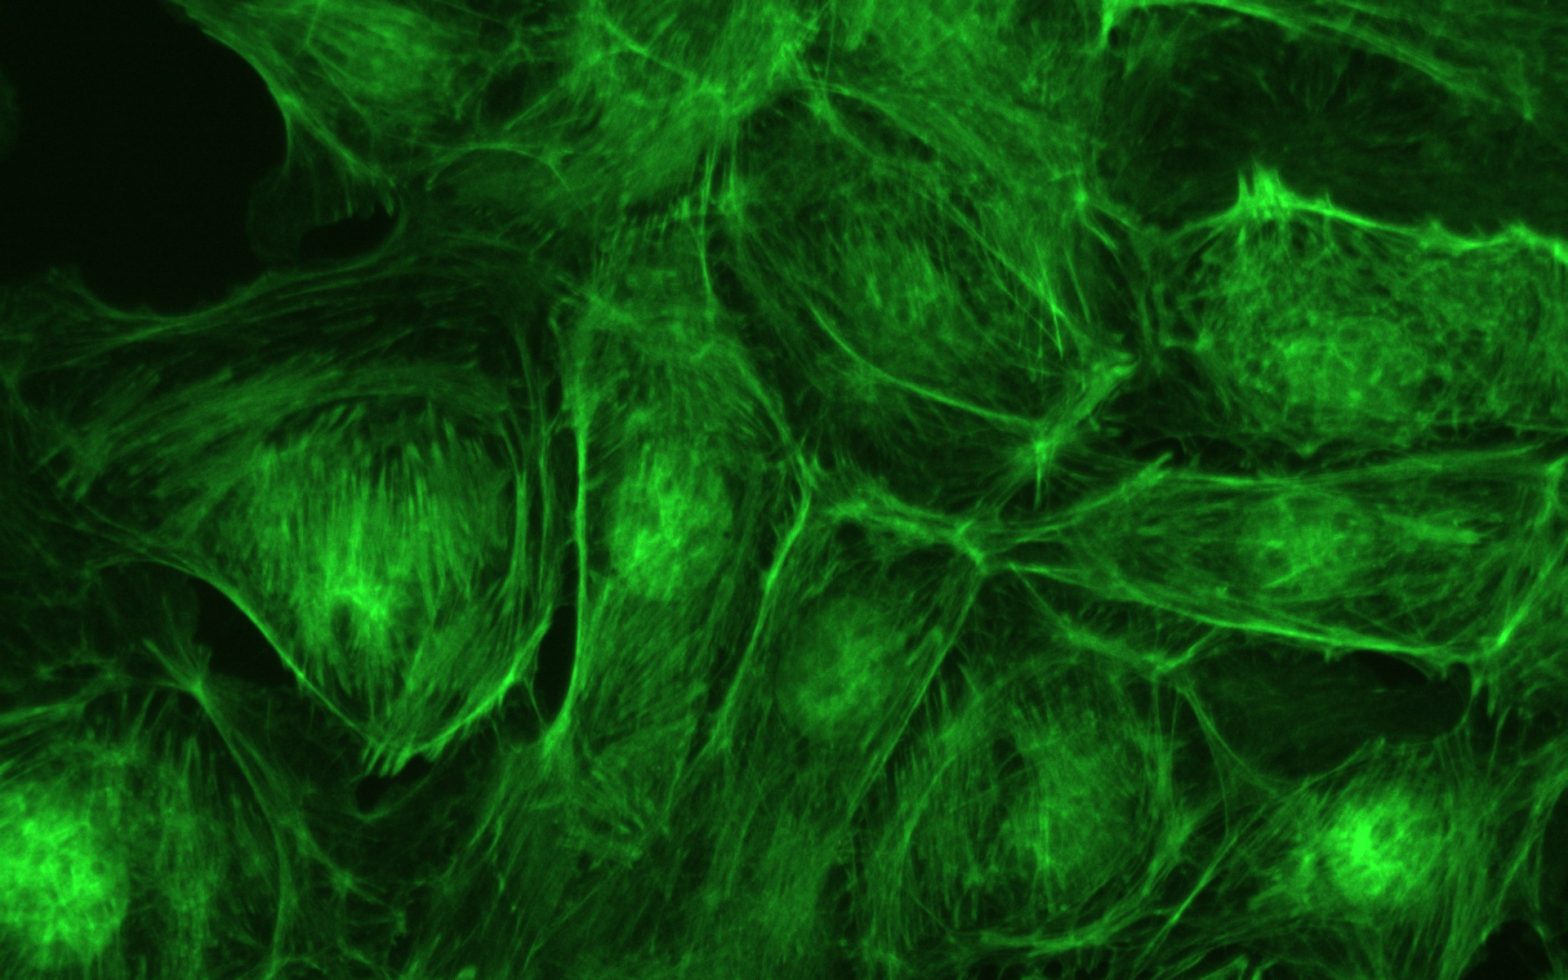
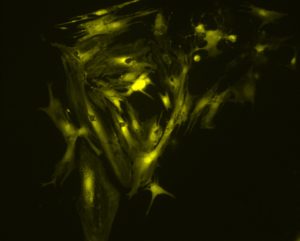
340nm Excitation
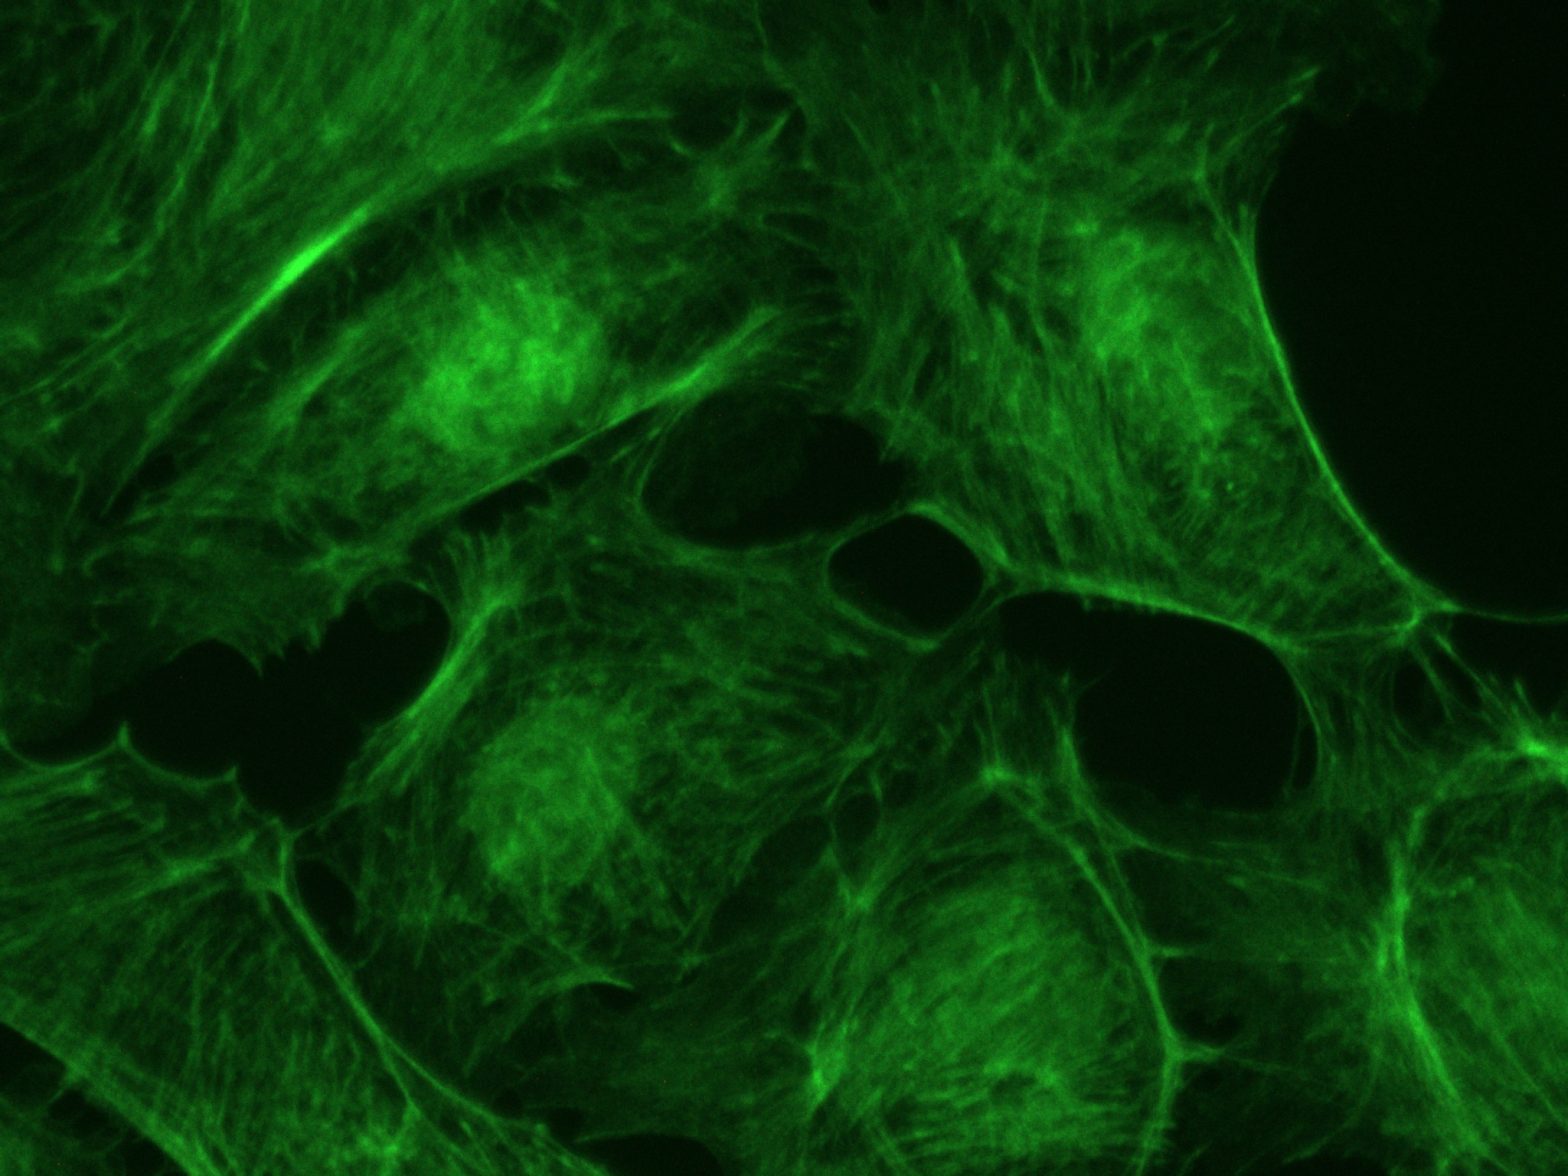
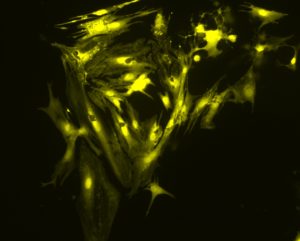
380nm Excitation
The images above show a field of cardiac myocytes (heart cells). The cells were loaded with Fura-2 using standard conditions (i.e. incubation with 2 micromolar Fura-2 acetoxymethyl ester for 30 minutes, followed by an additional 30 minutes for de-esterification.
Images were obtained by Martin Bootman and Katja Rietdorf, School of Life, Health and Chemical Sciences, The Open University, UK.
Until recently, the response time of illumination systems for Fura-2 imaging have been limited to milliseconds due to mechanical switching of the wavelengths in arc lamp and monochromator systems. However, the new pE-340fura can be controlled via convenient BNC TTL connections for precise illumination control in as little as 20 microseconds.
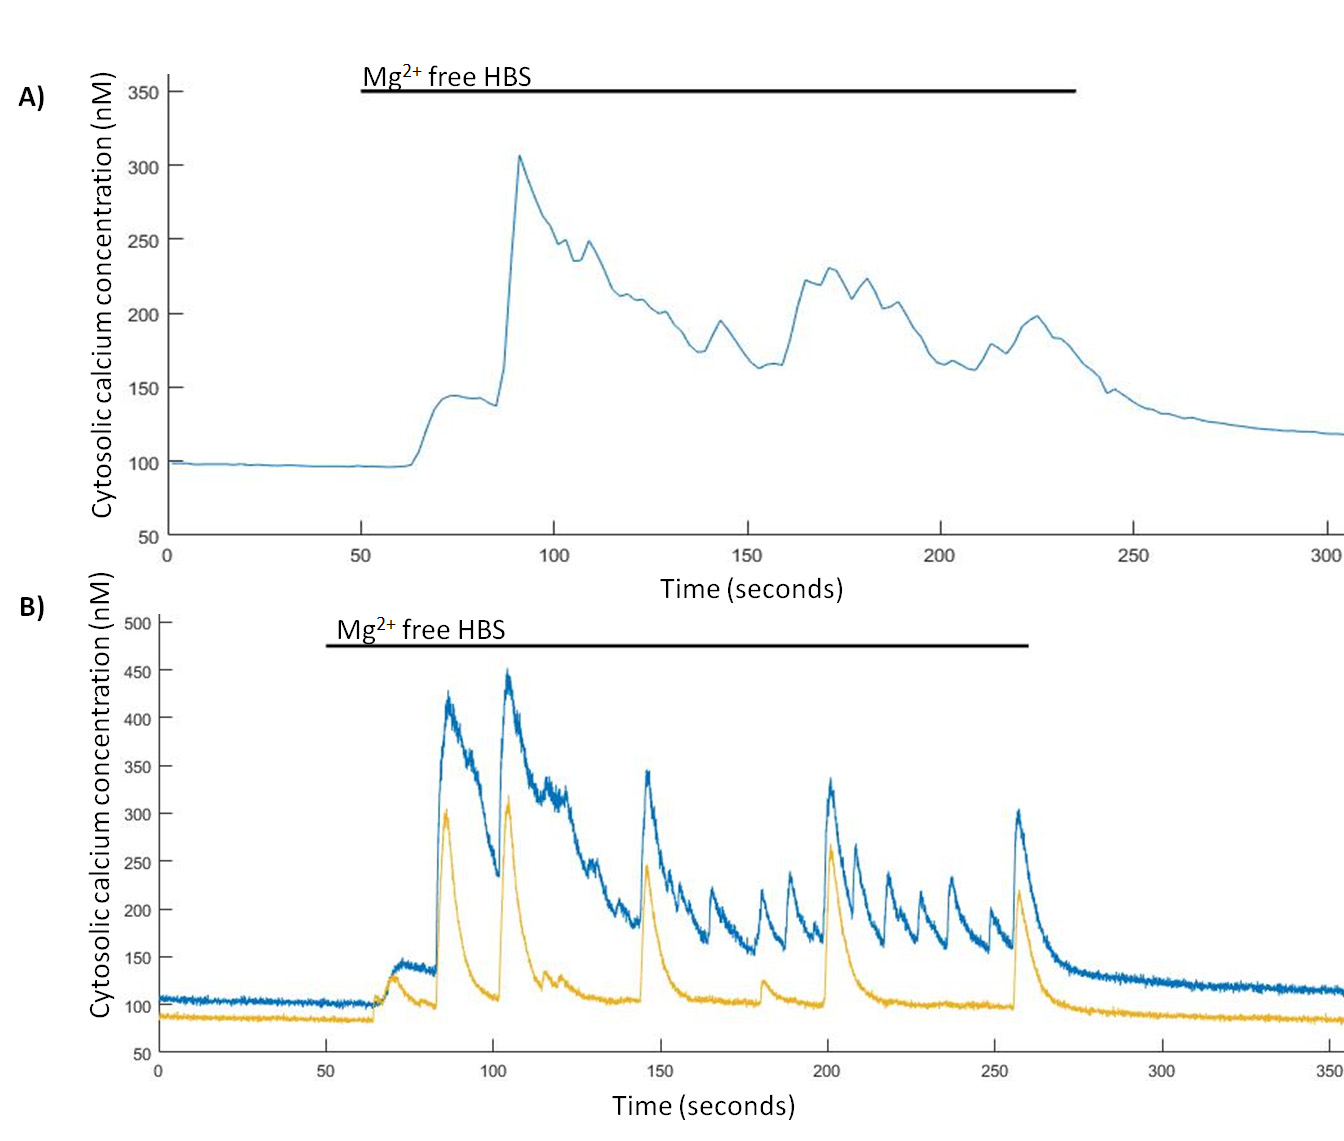
Spontaneous Ca2+ events are induced in Mg2+-free HBS. (A) Representative trace from a single hippocampal neuron of Mg2+-free induced Ca2+ events imaged at 0.5 Hz and (B) representative trace from two hippocampal neurons of Mg2+-free induced Ca2+ events imaged at 24.39 Hz.
TINNING, P. W., FRANSSEN, A. J. P.M., HRIDI, S. U., BUSHELL, T. J. and MCCONNELL, G. (2017), A 340/380 nm light-emitting diode illuminator for Fura-2 AM ratiometric Ca2+ imaging of live cells with better than 5 nM precision. Journal of Microscopy. doi:10.1111/jmi.12616
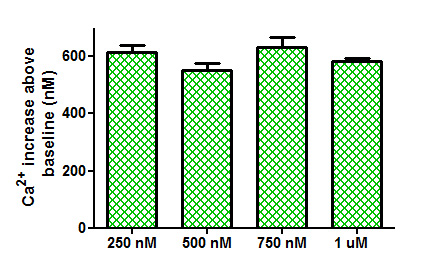
Using the new pE-340fura LED Illumination System, less Fura-2 dye can be loaded into the cells whilst still maintaining the same measured calcium concentration and good signal-to-noise ratio. The reduction in required dye not only improves cell-viability due to reduced dye toxicity, but also results in a cost reduction per experiment.
Comparison of Ca2+ increases obtained from the application of trypsin (100 nM) to tsA-201 cells loaded with different concentrations of Fura-2 AM.
TINNING, P. W., FRANSSEN, A. J. P.M., HRIDI, S. U., BUSHELL, T. J. and MCCONNELL, G. (2017), A 340/380 nm light-emitting diode illuminator for Fura-2 AM ratiometric Ca2+ imaging of live cells with better than 5 nM precision. Journal of Microscopy. doi:10.1111/jmi.12616
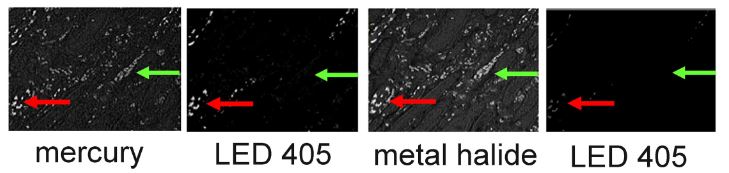
Work by Sandrine Prost et al., from the University of Edinburgh, has shown that with independent wavelength controllable LED sources, signal-to-noise is dramatically improved over bulb systems and even over some available white wide spectrum LED sources.
High levels of autofluorescence and fast photobleaching of specific fluorescence when illuminating Qdots with Metal Halide.
Prost S et al (2016) Choice of Illumination System & Fluorophore for Multiplex Immunofluorescence on FFPE Tissue Sections. PLoS ONE 11(9): e0162419. doi:10.1371/journal.pone.0162419
There are two pE-340fura configuration options:
Direct-fit for connecting to a microscopes – by selecting from a range of microscope adaptors which covers all current and most older models. A simple once only adjustment will allow optimisation to the optical path of the microscope.
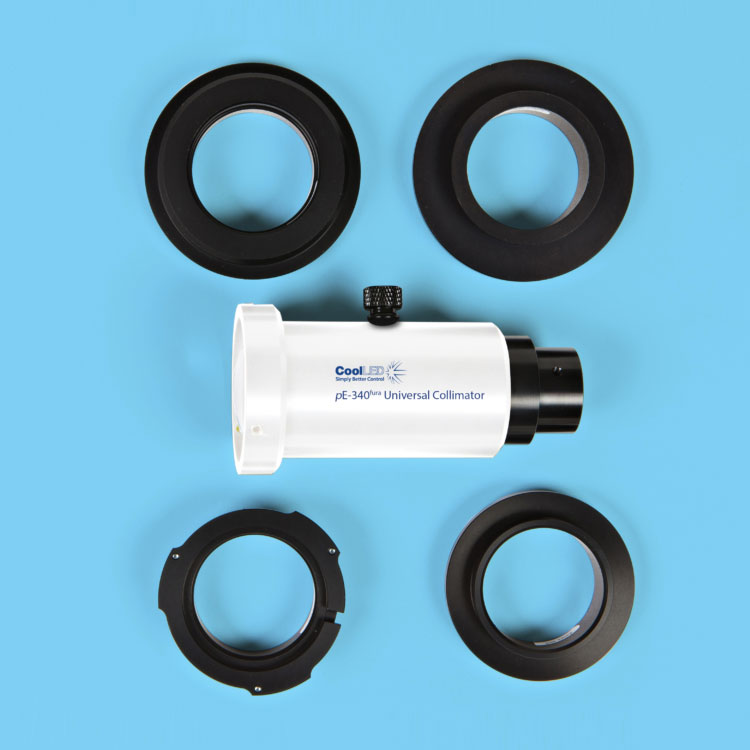
Liquid Light Guide with a fixed 3mm diameter, liquid light guide. An optional pE-340fura Universal Collimator can be specified in conjunction with a microscope adaptor if required, containing optics optimised to transmit the 340nm.
19세기 중순 경 개발되어짐. 초기에는 암석과 광물의 연구에 주로 사용되어졌으나, 점차로 그 용도가 넓어져서 의약품, 공업제품 등 산업 전반에 걸쳐 이용분야가 확대되었음.
편광현미경의 사용 목적
샘플의 광학적 성질의 조사하여 구성하는 물질이 무엇으로 이루어졌는지 동정(同定) 하기 위해 사용 됨.
광학적 성질에 의한 샘플의 분류
광학적등방체 ( (Isotropic material )
: 샘플에 빛이 통과 할때 어떠한 방향으로 빛이 진행하더라도 모든 방향에 대하여 동일한 광학적 영향을 준다.(복굴절 하지 않는다.)
예: 유리 등
광학적이방체 ( Anisotropic material )
: 샘플에 빛이 통과 할때 빛이 진행하는 방향(각도)에 따라 다양한 복굴절을 한다.
– 일축성 결정_이방체 (uniaxial anisotropic body) : 빛이 진행 할 때 복굴절하지 않는 광축을 하나만 가지고 있다. 예: 방해석, 석영 등
– 이축성 결정_이방체 (biaxial anisotropic body) : 빛이 진행 할 때 복굴절하지 않는 광축을 두개 가지고 있다. 예: 운모, 장석, 각섬석, 휘석, 감람석 등
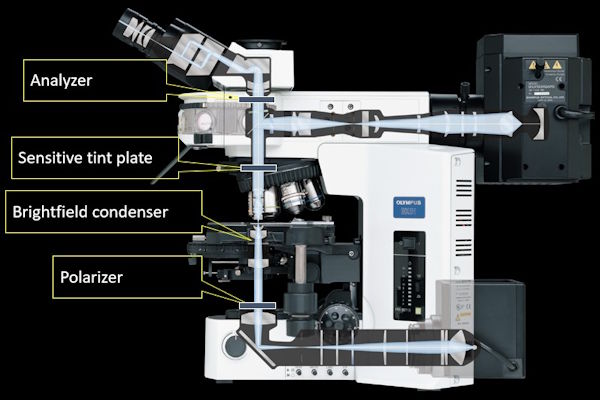
전용 편광 현미경의 구성품 (일부)
Compensator에 대한 구성 및 설명은 포함되어 있지 않습니다.
투과형 편광 & 반사형 형광 현미경 (전용편광현미경의 사진이 아닙니다.) 이 장비는 투과형 편광현미경에 Tint plate가 추가된 현미경 입니다. 전용 편광현미경은 스테이지와 검광자의 회전각을 각각 읽을 수 있어야 합니다.
The First Order (Full wave) Retardation Plate
제조사
분류
일반명칭
모델명
OLYMPUS JAPAN
편광전용현미경
λ필터
U-TP530
Optical path differences ranging from a fraction of a wavelength up to several wavelengths can be readily estimated using a first order (or full wave) retardation plate. This versatile tool is known by several names, including a red plate, red-I (red-one) plate, lambda (λ) plate, gypsum plate, selenite plate, sensitive violet, or simply a color tint plate, and adds a fixed optical path difference between 530 and 560 nanometers (depending upon the manufacturer) to every wavefront in the field. The first order retardation plate is a standard accessory that is frequently utilized to determine the optical sign (positive or negative) of a birefringent specimen in polarized light microscopy. In addition, the retardation plate is also useful for enhancing contrast in weakly birefringent specimens.
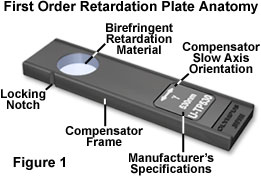
The elegantly simple anatomy of a first order retardation plate is presented in Figure 1 for a typical commercial unit. Retardation materials employed in construction of the plate vary according to the application, but usually consist of either an optical mineral thin section (such as gypsum/selenite, quartz, calcite, or mica) or a highly aligned birefringent linear organic polymer sandwiched between two isotropic optically flat glass plates. Regardless of the material used in producing retardation, the optical path difference (usually inscribed on the retardation plate frame) and optical axis orientation of the birefringent retarding material must be carefully controlled so that the plate can add a known retardation value to both the high and low refractive index azimuths. As illustrated in Figure 1, the birefringent retardation material is positioned in a rectangular frame that is inserted into the microscope optical pathway at a 45-degree angle with respect to the transmission orientations of the polarizer and analyzer. The direction of the slow (high refractive index) axis of the wavefront ellipsoid is indicated on the retardation plate frame as a double-headed arrow accompanied by the Greek symbol for “gamma” (γ). In most cases, the slow axis orientation is perpendicular to the long dimension of the retardation plate frame, although this fact should be verified before attempting to use the instrument. Modern first order retardation plates are built in a frame having standardized DIN dimensions (6 × 20 millimeters) that will enable their use in a variety of microscopes.
The first order retardation plate is designed to introduce a relative retardation of exactly one wavelength (in the green or 550 nanometer region) between the ordinary and extraordinary wavefronts passing through the plate when the birefringent retardation material is illuminated by linearly polarized light at a 45-degree incident angle to the index ellipsoid.
As a result, green wavelengths emerge from the retardation plate crystal still linearly polarized and having the same orientation as when they entered the retardation material (parallel to the polarizer). These wavelengths are perpendicular to the analyzer, thus are absorbed and do not pass through.
The orthogonal wavefronts of all other wavelengths will experience some degree of retardation (less than a full wavelength) and will emerge from the retardation plate having varying degrees of elliptical polarization. These wavefronts are therefore able to pass a component vector through the analyzer. Subtracting the green wavelengths (blocked by the analyzer) from white light yields bright magenta-red, which results from a combination of all visible light spectral colors when the green wavelength band is missing. The magenta color observed in the microscope when a first order retardation plate is inserted into the optical train is a direct result of the events described above and is the origin for much of the common nomenclature describing this important qualitative tool.
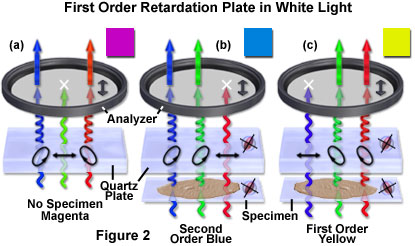
The behavior of a quartz first order retardation plate in polarized white light, symbolized by a combination of red, green, and blue wavefronts, is reviewed in Figure 2. Without a specimen in the optical pathway (Figure 2(a)), the retardation plate induces an elliptical polarization vector to the red and blue waves as they pass through, but the green light travels through the quartz crystal as a linearly polarized wavefront that is absorbed by the analyzer. As a result, only a component of the red and blue waves is able to pass through the analyzer to produce a spectrum of white light minus the green wavelengths, which is seen in the microscope as a bright magenta background.
When a birefringent specimen with a wavefront ellipsoid parallel to the retardation plate is inserted into the optical pathway (Figure 2(b)), the relative retardation of orthogonal wavefronts is increased across the viewfield so that the color (red) now exhibiting linear polarized behavior is shifted to longer wavelengths. The blue and green wavelengths are elliptically polarized and interfere at the intermediate image plane to form a hue similar to second order blue (an addition color). Rotating the specimen by 90 degrees alters the relationship between the wavefront ellipsoids (Figure 2(c)) so that they are now perpendicular. In this case, the relative retardation of the orthogonal wavefronts is decreased across the viewfield and the shorter (blue) wavelengths emerge as linearly polarized light (only to be absorbed by the analyzer). Elliptically polarized green and red wavelengths ultimately recombine to form a first order yellow (subtraction) interference color.
Inserting a first order retardation plate into the optical path of a polarized light microscope introduces a dramatic display of interference colors in thin, birefringent specimens that is not only aesthetically beautiful, but also highly useful as an indicator of several optical properties. Quantitative evaluations of relative retardation and determinations of the index ellipsoid orientation are readily achieved with a first order retardation plate. In geological and materials investigations, first order retardation plates are often employed to determine specimen thickness and to identify birefringent crystalline and polymeric materials. The tool is capable of measuring retardations with an accuracy of approximately 2 nanometers in specimens that have relatively low (one-third of a wavelength) optical path differences.
With simple uniaxial birefringent materials, the first order retardation plate can be employed to determine whether the extraordinary wavefront is slower or faster than the ordinary wavefront and thus determine the sign of birefringence. If the extraordinary wavefront is slower than the ordinary wavefront, the specimen displays positive birefringence. Conversely, a negative sign of birefringence is observed in specimens that have an ordinary wavefront that is slower than the extraordinary wavefront. First order retardation plates are ideal for use with specimens that have very low order (or only gray-level) interference colors when observed in the polarized light microscope. Before attempting an analysis of birefringence, specimens must first be oriented with the index ellipse in a diagonal position (45-degree angle) with respect to the microscope polarizer and analyzer. The two vibration (ordinary and extraordinary) azimuths will then run Northeast-Southwest and Northwest-Southeast, whereas the polarizer is oriented East-West and the analyzer North-South (as seen in the microscope viewfield).
After the specimen has been properly oriented, the colors appearing in the microscope eyepieces represent interference that is generated by the additive effects of the specimen and the first order retardation plate. If the specimen slow vibration axis is superimposed over the corresponding axis of the retardation plate, the additive retardation effects will result in higher order interference colors (termed theadditive position). However, if the fast axis of the specimen is parallel to the slow axis of the retardation plate, the relative retardation will be decreased and result in lower order interference colors (thesubtractive position). As an example, in a relatively thin, elongated birefringent crystal that displays only first order gray intensities under crossed polarized illumination, addition of a first order retardation plate to the optical train will result in quadrants that display blue and yellow interference colors, depending upon the orientation of the crystal. In positive crystals, yellow interference colors are observed when the crystal is oriented Southeast to Northwest, while blue colors result from rotating the crystal by 90 degrees (into a Northeast-Southwest direction). Likewise, negative crystals exhibit yellow colors when oriented Northeast-Southwest and blue colors when oriented Southeast-Northwest.
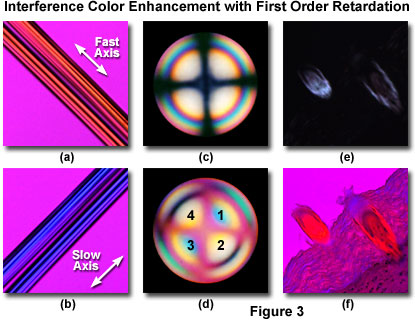
This effect is illustrated with a pair of synthetic acetate fibers in Figures 3(a) and 3(b). Without a first order retardation plate in the optical path, the fibers appear birefringent with a 140-nanometer first order gray intensity superimposed on a jet black background (not illustrated). When the long axis of the synthetic acetate is oriented Northwest-Southeast and a first order retardation plate inserted into the microscope tube, the fibers acquire a first order yellow hue on a magenta background (Figure 3(a)). Rotating the microscope stage by 90 degrees (Northeast-Southwest) alters the interference color to second order blue (Figure 3(b)). From these results, the optical sign of birefringence for the acetate fibers is judged to be positive.
The sign of birefringence can also be readily determined using a first order retardation plate coupled to observation of conoscopic interference patterns with a Bertrand lens (see Figures 3(c) and 3(d)). When a Bertrand lens is inserted into the optical train of a polarized light microscope (between the objective rear aperture and the observation tubes), the conoscopic image of a uniaxial quartz crystal appears as a series of concentric rings having increasing orders of interference fringes from the center to the periphery, which are superimposed on a darkened Maltese cross (Figure 3(c)). Inserting a first order retardation plate into the microscope nosepiece or intermediate tube divides the image into quadrants that display higher order interference colors (Figure 3(d)). If the first and third quadrants (see Figure 3(d)) of the conoscopic image produce additive interference colors (blue and higher), the crystal is positively birefringent. However, if the second and fourth quadrants add to higher interference colors, the crystal is negatively birefringent. The conoscopic image of quartz (Figure 3(d)) reveals that the optical sign of birefringence is positive in quartz having this crystalline lattice structure. Biaxial crystals can also be examined conoscopically to determine their sign of birefringence.
First order retardation plates are also efficient at increasing contrast in very weakly birefringent specimens that are difficult or impossible to detect using crossed polarized illumination alone. Many of the common birefringent biological assemblies examined in polarized light, such as cell walls, starch granules, lignin, microtubules, and actin filaments, fall into this category. An excellent example is provided by a thin section of human tongue, which displays several birefringent structures (Figures 3(e) and 3(f)) of varying intensity. In crossed polarized illumination (Figure 3(e)), weakly birefringent condensed formations at the edge of the tissue are difficult to image and striated muscle tissue supporting the structures is absent. In contrast, when a first order retardation plate is added to the optical train, the structure of all birefringent features becomes readily apparent (Figure 3(f)) and the higher order (blue and yellow) interference colors provide an indication of the optical sign.
The Quarter Wavelength Retardation Plate
제조사
분류
일반명칭
모델명
OLYMPUS JAPAN
편광전용현미경
1/4λ필터
U-TP137
The quarter wavelength retardation plate is a common optical accessory for polarized light microscopy that operates by introducing a relative phase shift of 90 degrees between the orthogonal wavefronts (ordinary and extraordinary) passing through when the plate is illuminated with linearly polarized light. A phase shift of 90 degrees between the ordinary and extraordinary components converts the incident linear polarized light vibrations into either elliptical or circularly polarized light. Quarter wavelength retardation plates are useful for the qualitative analysis of conoscopic and orthoscopic images, and for the assessment of optical path differences in birefringent specimens.
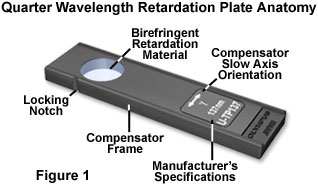
The simple anatomy of a quarter wavelength retardation plate is presented in Figure 1 for a typical commercial unit. Retardation materials employed in construction of the plate vary according to the application, but usually consist of either an optical mineral thin section (such as quartz or mica) or a highly aligned birefringent linear organic polymer sandwiched between two isotropic optically flat glass plates. Regardless of the material used in producing retardation, the optical path difference (usually inscribed on the retardation plate frame) and optical axis orientation of the birefringent retarding material must be carefully controlled so that the plate can add a known retardation value to both the high and low refractive index azimuths of orthogonal wavefronts. As illustrated in Figure 1, the birefringent retardation material is positioned in the window of a rectangular frame that is inserted into the microscope optical pathway at a 45-degree angle with respect to the transmission orientations of the polarizer and analyzer. The direction of the slow (high refractive index) axis of the wavefront ellipsoid is indicated on the retardation plate frame as a double-headed arrow accompanied by the Greek symbol for “gamma” (γ). In most cases, the slow axis orientation is perpendicular to the long dimension of the retardation plate frame, although this fact should be verified before attempting to use the instrument. Modern quarter wavelength retardation plates are built in a frame having standardized DIN dimensions (6 × 20 millimeters) that will enable their use in a variety of microscopes.
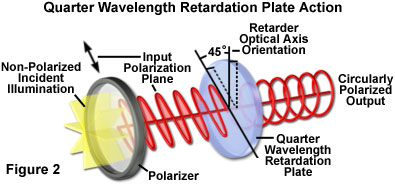
The quarter wavelength retardation plate is designed to introduce a relative retardation of exactly one-quarter wavelength (in the green or 550 nanometer region), or 90 degrees, between the ordinary and extraordinary wavefronts passing through the plate when the birefringent retardation material is illuminated by linearly polarized light at a 45-degree incident angle to the index ellipsoid, as illustrated in Figure 2. The resulting phase shift converts the linear input wavefront to a circularly polarized output wavefront. This action occurs because the orthogonal ordinary and extraordinary components have equal amplitudes when linear light oriented at a 45-degree angle to the principal (the fast or slow) axes is incident on a quarter wavelength retardation plate. In a similar manner, the quarter wavelength plate will convert an incoming circularly polarized wavefront into a linearly polarized wavefront.
Commercial quarter wavelength retardation plates are specified by their linear retardation, which is 137 nanometers for the device illustrated in Figure 1 that is designed to operate in light having a principal wavelength of 548 nanometers (in the green region). In polarized light microscopy applications, the quarter wavelength plate is utilized in a similar manner to the full wave retardation plate in order to determine whether the combination of a weakly birefringent specimen and the plate (oriented at a 45-degree angle to the polarizer and analyzer) yield higher or lower order interference colors. However, the quarter wavelength plate has been largely supplanted by the full wave retardation plate due to the superior sensitivity of the latter in producing color changes that can be readily observed. In cases where birefringent specimens display higher order interference colors between crossed polarizers without a retardation plate, then the quarter wavelength plate can often be used to advantage over the full wave plate to determine optical path differences.
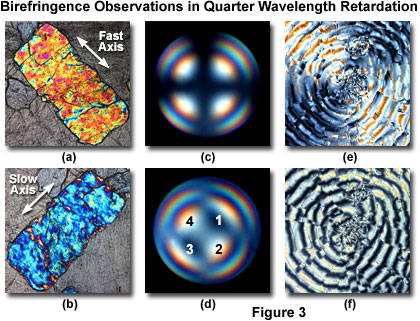
This concept is illustrated in Figures 3(a) and 3(b) for a polished thin section of tactic skarn, which contains inclusions that exhibit first and second order interference colors in polarized light without the presence of a retardation plate or compensator. When a first order retardation plate is employed to determine the optical sign of this birefringent ore, the interference colors are shifted up the Michel-Levy chart by a single wavelength and can lead to confusion during quantitative analysis. Conversely, using a quarter wavelength plate instead produces the customary first order yellow for the fast optical axis (Figure 3(a)) and second order blue hue for the slow axis (Figure 3(b)), allowing for easier identification of the optical properties.
The primary use for quarter wavelength retardation plates is to determine the optical sign of birefringence from interference figures observed in conoscopic mode with a Bertrand lens (Figures 3(c) and 3(d)). Insertion of a quarter wavelength retardation plate resolves the center of a uniaxial interference figure (Figure 3(c)) into two dark spots (Figure 3(d)). If the dark spots are positioned at right angles to the slow vibration axis of the compensator crystal (in quadrants two and four; Figure 3(d)), then the sign of birefringence for the crystal is positive. Conversely, if the dark spots are positioned parallel to the compensator crystal slow axis (in quadrants one and three; Figure 3(d)), the crystal has a negative sign of birefringence. Note that other rings in the interference pattern are translated either towards the center or the periphery of the pattern according to the optical sign. The interference pattern in Figure 3(c) was generated conoscopically using a polished thin section of the mineral lamproite, which exhibits negative birefringence. A similar technique can be employed to determine the optical sign of birefringence for biaxial crystals.
The extinction bands in polarized light images can be eliminated for image analysis purposes by inserting crossed quarter wavelength retardation plates into the microscope optical path with the specimen sandwiched between the two plates. In effect, the retardation introduced by the first quarter wavelength plate is precisely cancelled by the second, so that light reaching the analyzer contains only the retardation introduced by the specimen itself. In practice, one of the retardation plates is inserted into the nosepiece or intermediate tube slot with the slow vibration axis oriented Northeast-Southwest (by convention in modern microscopes). The second plate must be placed between the polarizer and the specimen (usually in or very near the condenser) with the slow axis oriented Northwest-Southeast. The two plates should be fabricated from the same material in order to completely eliminate extinction bands. If the two plates are accurately aligned, a minimum change of polarization colors will be observed in birefringent specimens as they are rotated through 360 degrees with the microscope circular stage. Images of purified riboflavin (Vitamin B2) crystallites in polarized light (Figure 3(e)) alone, and with quarter wavelength retardation plates inserted beneath the stage and above the objective rear aperture are illustrated in Figures 3(e) and 3(f), respectively. Note that the extinction regions of the spherulitic crystallite present in Figure 3(e) have been eliminated by the application of two quarter wavelength plates (Figure 3(f)), which more clearly defines the texture.
In summary, the quarter wavelength retardation plate is capable of detecting optical path differences of (plus or minus) one-half wavelength by rotating the stage through 90 degrees. In this regard, the plate has a sensitivity range lying between the Bräce-Köhler and quartz wedge compensators and overlaps with the de Sénarmont compensator. Unlike many of the adjustable compensators, the quarter wavelength retardation plate can be effectively used in white light, but the most accurate results are obtained when the plate is coupled to the wavelength for which the crystal was prepared (for example, 548 nanometer green light for a 137 nanometer plate). The retardation plate can also be used to produce circularly polarized light by inserting it into the optical path above the polarizer.